Recently I am working with an issue that complains about etcd WAL fsync met high P99 Latency.
Then a question appeared on my head: How the IO of etcd looks like? Is it unfriendly to our storage device?
Then I used the biosnoop in bcc-tools to recorded the IO of etcd about one hour.
That is the result:
- most IO size are 4KB aligned;

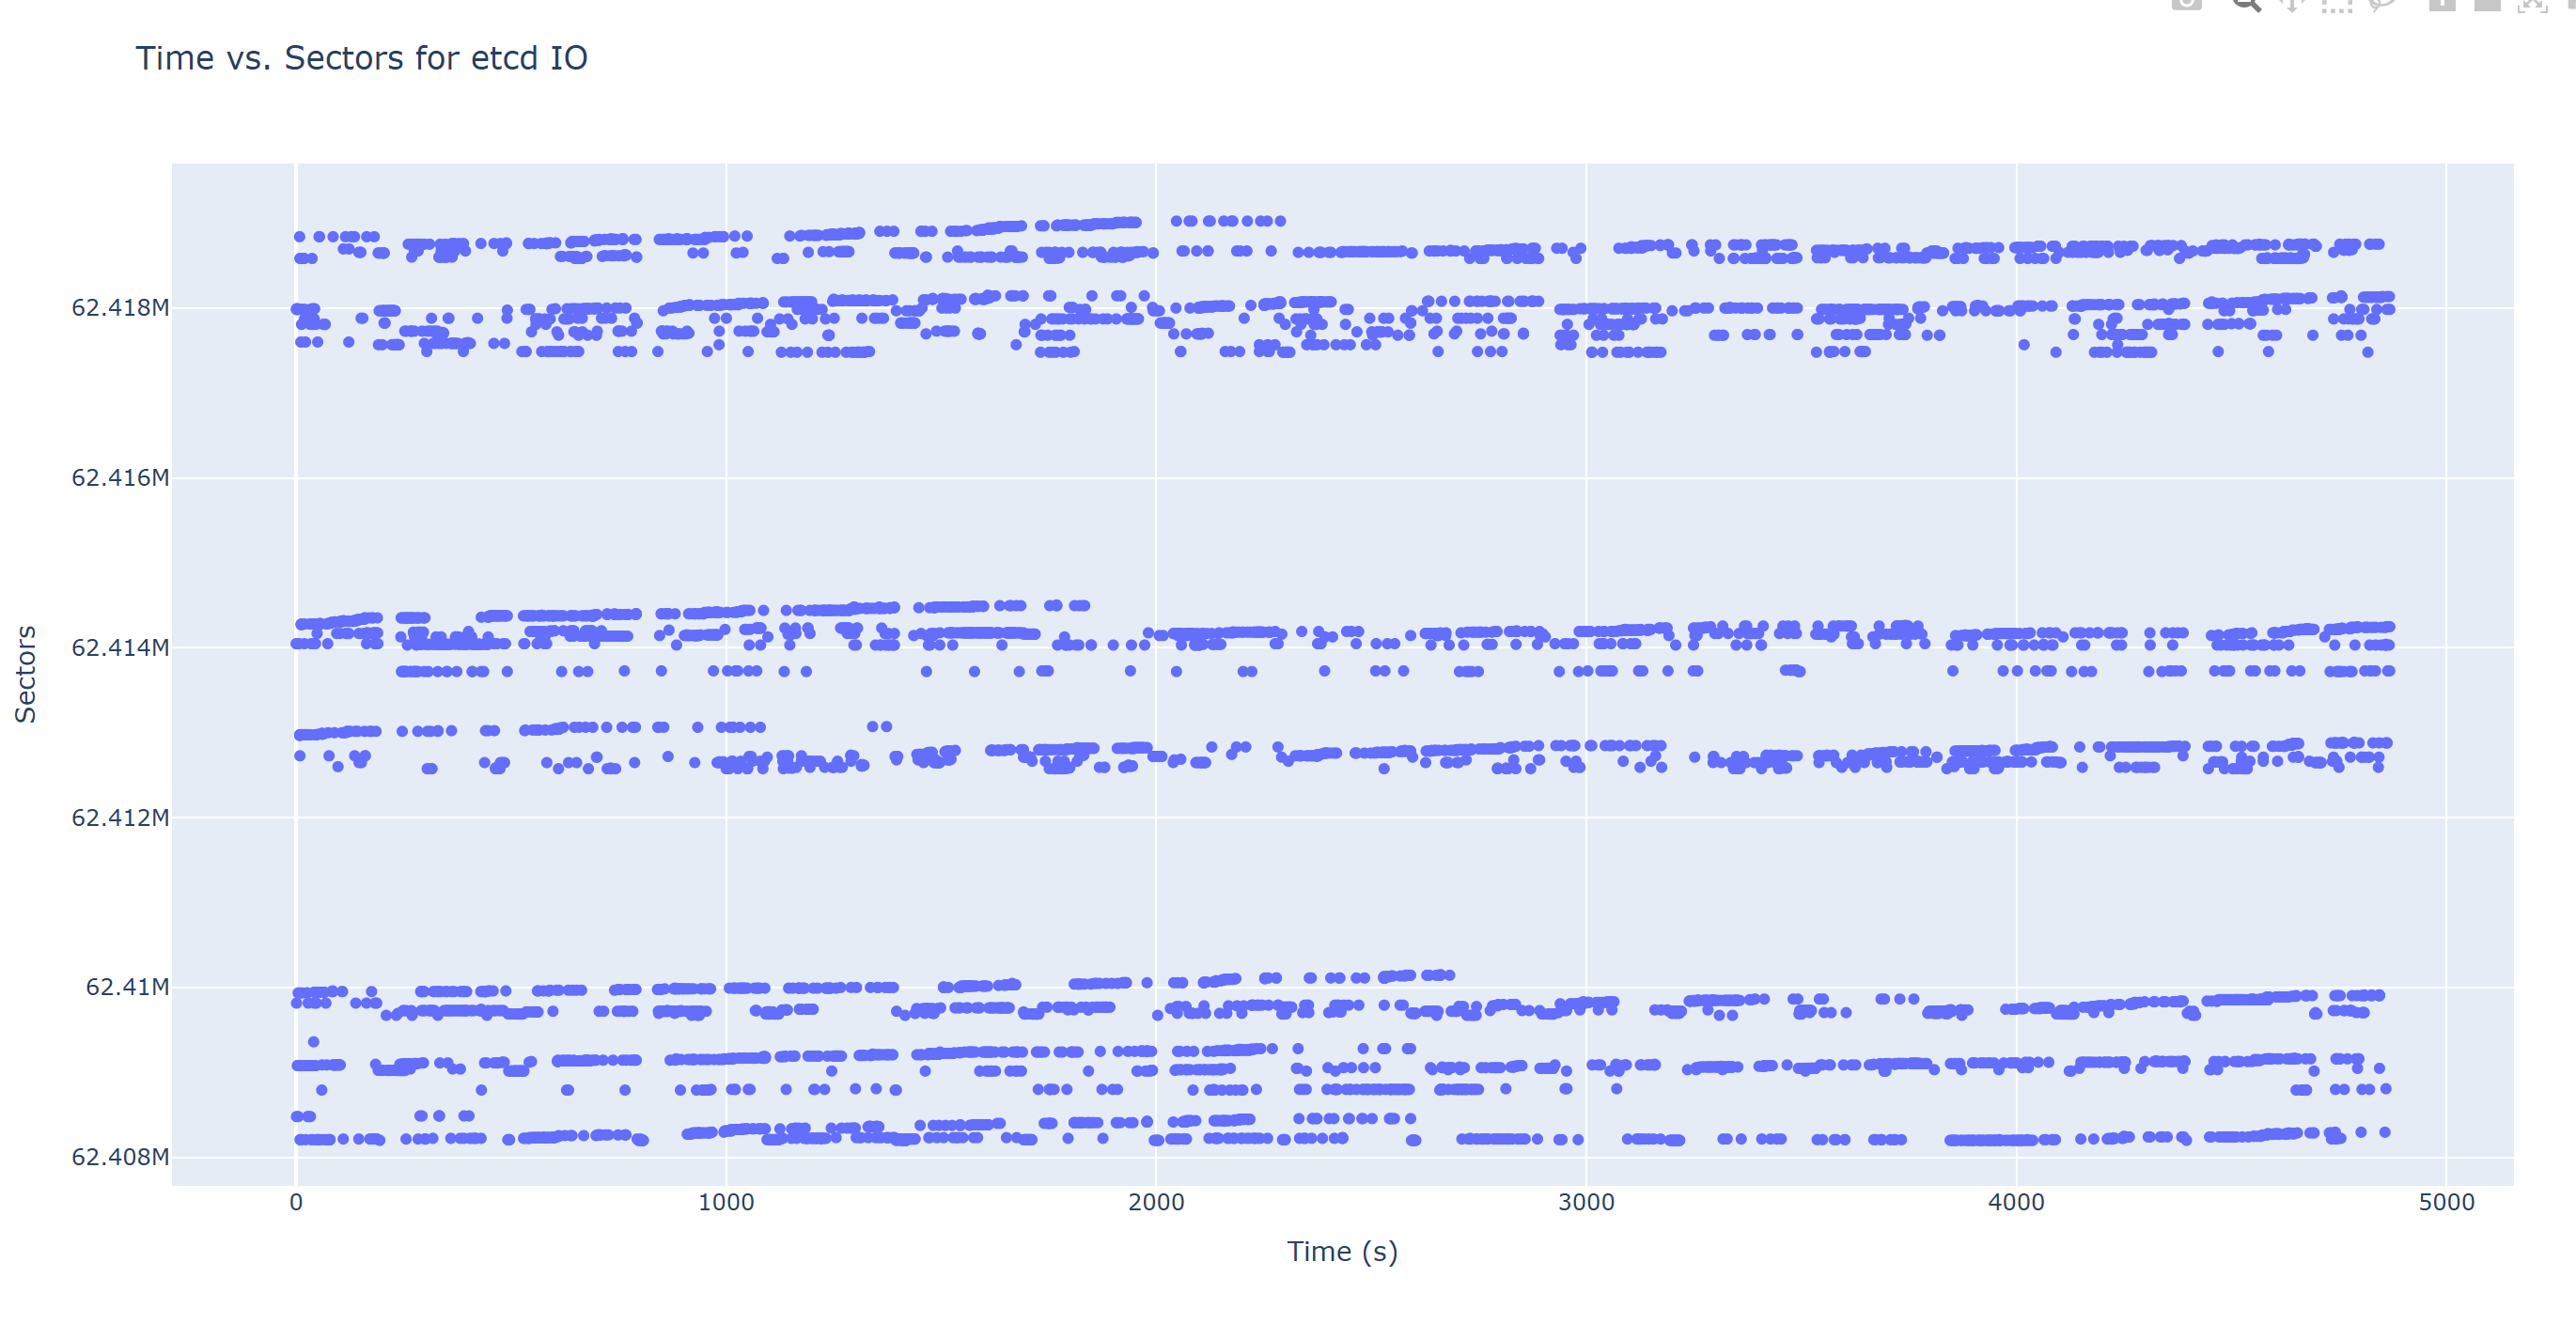
- these IO just hit several range of the block device;

- zoom in and we can see it usually write to many files simultaneously, most are sequential IO;
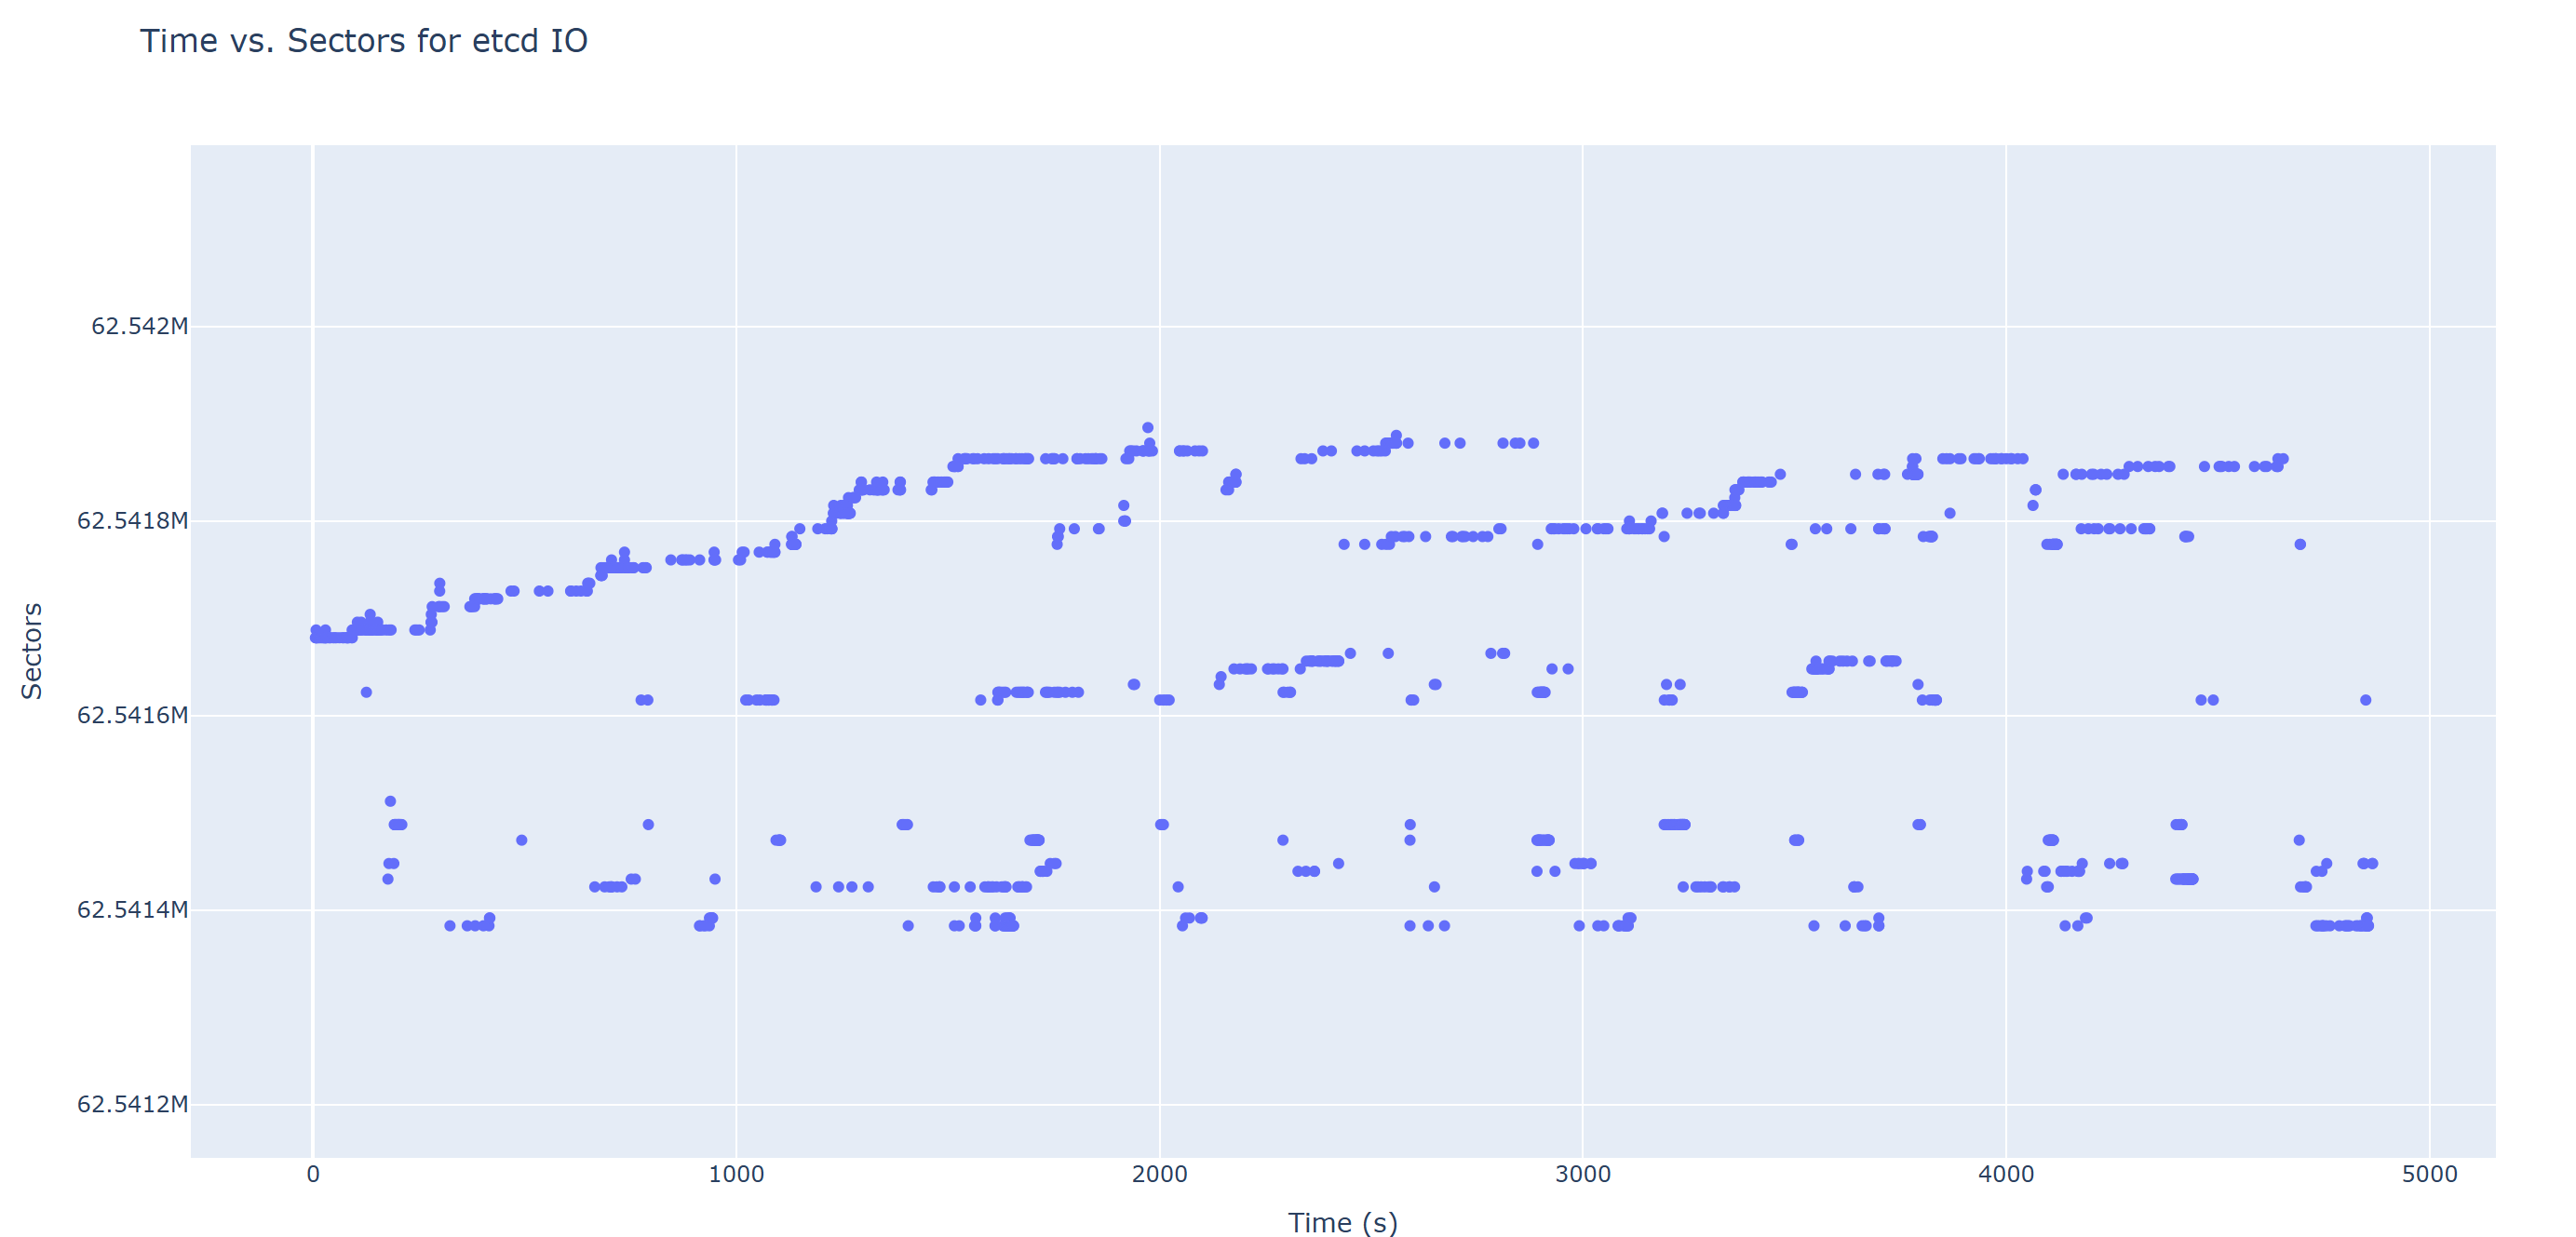
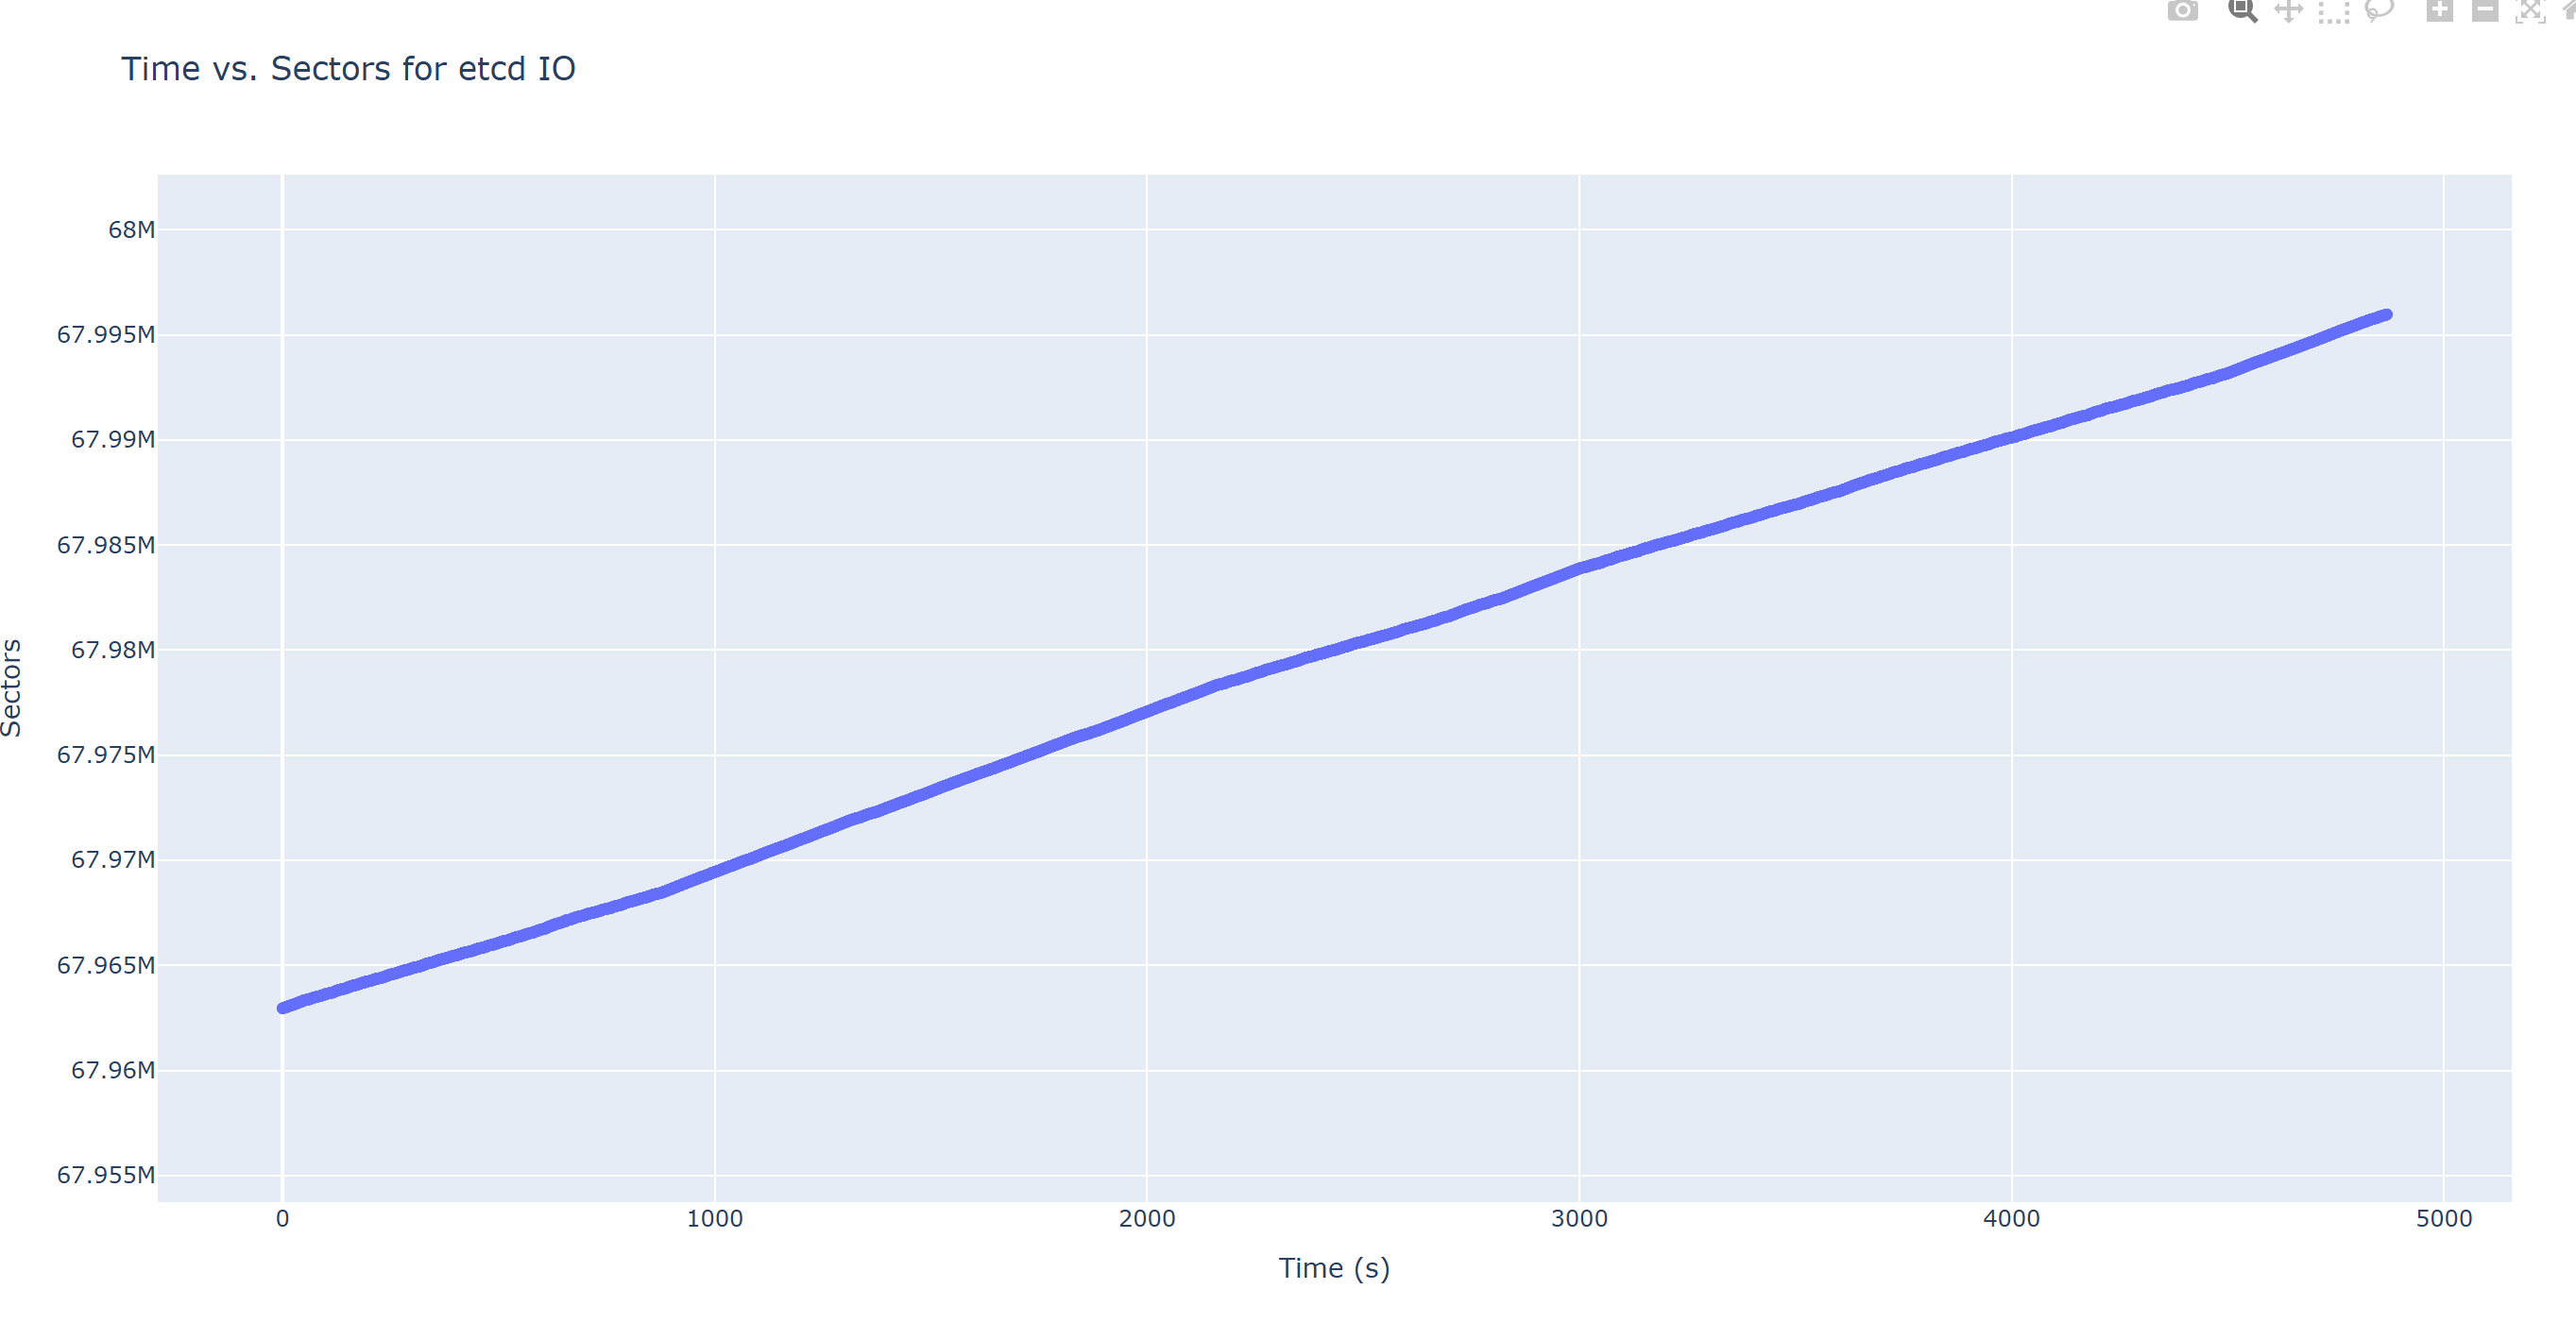
- and finally I found a perfect sequential IO offset line.
Conclusion
So the result is: the IO pattern of etcd is very friendly to block storage devices, if you found etcd not works fine with your storage device, you must find root cause from your storage device.
Refs:
- Slow etcd performance (performance testing and optimization) | Support | SUSE
- Code to process the biosnoop logs
import plotly.graph_objects as go
import pandas as pd

import argparse

parser = argparse.ArgumentParser(description='Analyze etcd IO latency from a file.')
parser.add_argument('file_path', help='Path to the input file containing the data.')
args = parser.parse_args()

with open(args.file_path, 'r') as file:
    data = file.read()

# Parse the data
import io
df = pd.read_csv(io.StringIO(data), delim_whitespace=True)

# Filter for etcd entries
etcd_df = df[df['COMM'] == 'etcd']

# Create scatter plot for time vs. latency
fig_latency = go.Figure(data=go.Scatter(x=etcd_df['TIME(s)'], y=etcd_df['LAT(ms)'], mode='markers'))
fig_latency.update_layout(title='Time vs. Latency for etcd IO', xaxis_title='Time (s)', yaxis_title='Latency (ms)')

# Create scatter plot for time vs. bytes
fig_bytes = go.Figure(data=go.Scatter(x=etcd_df['TIME(s)'], y=etcd_df['BYTES'], mode='markers'))
fig_bytes.update_layout(title='Time vs. Bytes for etcd IO', xaxis_title='Time (s)', yaxis_title='Bytes')

# Create scatter plot for time vs. sectors
fig_sectors = go.Figure(data=go.Scatter(x=etcd_df['TIME(s)'], y=etcd_df['SECTOR'], mode='markers'))
fig_sectors.update_layout(title='Time vs. Sectors for etcd IO', xaxis_title='Time (s)', yaxis_title='Sectors')

# Additional statistical analysis
# Calculate mean, median, and standard deviation of latency for etcd
latency_stats = etcd_df['LAT(ms)'].describe()

# Save the plots as HTML files
import os
if not os.path.exists("./reports"):
    os.mkdir("./reports")

fig_latency.write_html("./reports/latency_plot.html")
fig_bytes.write_html("./reports/bytes_plot.html")
fig_sectors.write_html("./reports/sectors_plot.html")

# Start a simple HTTP server to serve the HTML files
import http.server
import socketserver

PORT = 19999
Handler = http.server.SimpleHTTPRequestHandler

with socketserver.TCPServer(("", PORT), Handler) as httpd:
    print("Serving at port", PORT)
    httpd.serve_forever()